
The importance of the histogram leads us today to update and republish this article, so you don't lose sight of it ? . If you are starting out in the wonderful world of photography, you will have already realized that photographing is not just pressing a button and trying not to cut off anyone's head. Photography has many variables, many whys, many explanations. Although anyone is capable of pressing a button and taking a photograph, not everyone is capable of solving it, that is, of visualizing it, thinking about it, and finding the best way to carry out or capture your idea. It's like painting: anyone can draw a portrait, even with a 6 and a 4 (do you remember? ? ), but not everyone will paint Las Meninas. For that, a lot of technique is necessary, a lot of practice, a lot of tenacity and a lot of photographic learning.
If photography is literally "painting with light" you will have already guessed that the secret is to know it, learn it, anticipate it, understand it and get the most out of it.
There are many concepts that you will gradually add to your photographic baggage: Diaphragm, shutter speed, ISO , white balance and a long etcetera. But I dare say that one of the least resonant in your mind when you start is histogram . Perhaps it is because we find it terribly complicated in a new world full of concepts, but if there is one of those concepts that you have to retain from the beginning, this is it. And I'll show you why ?
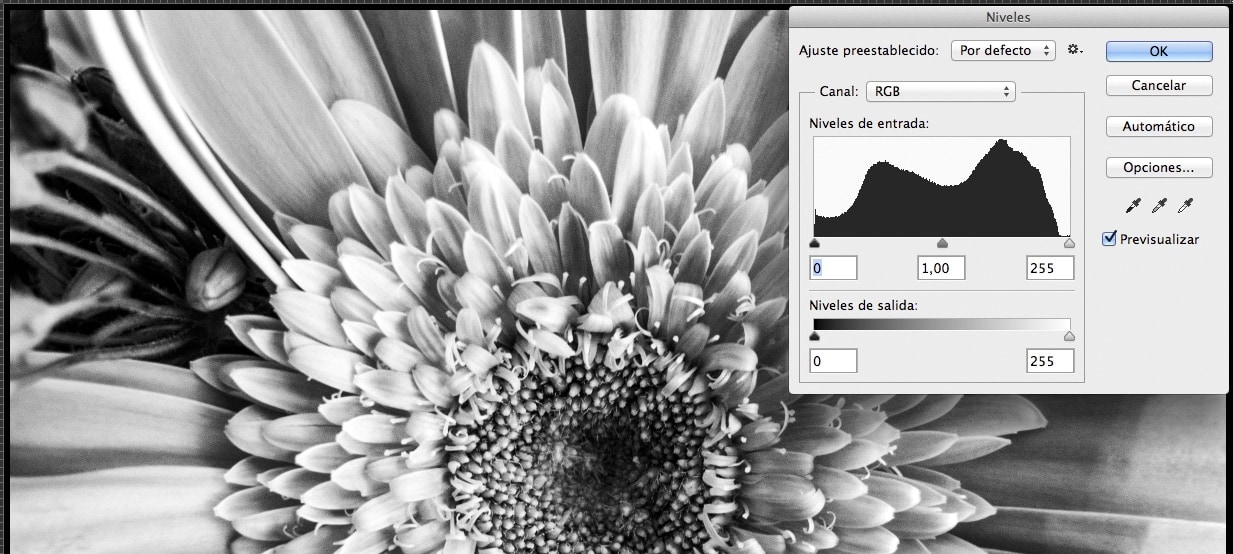
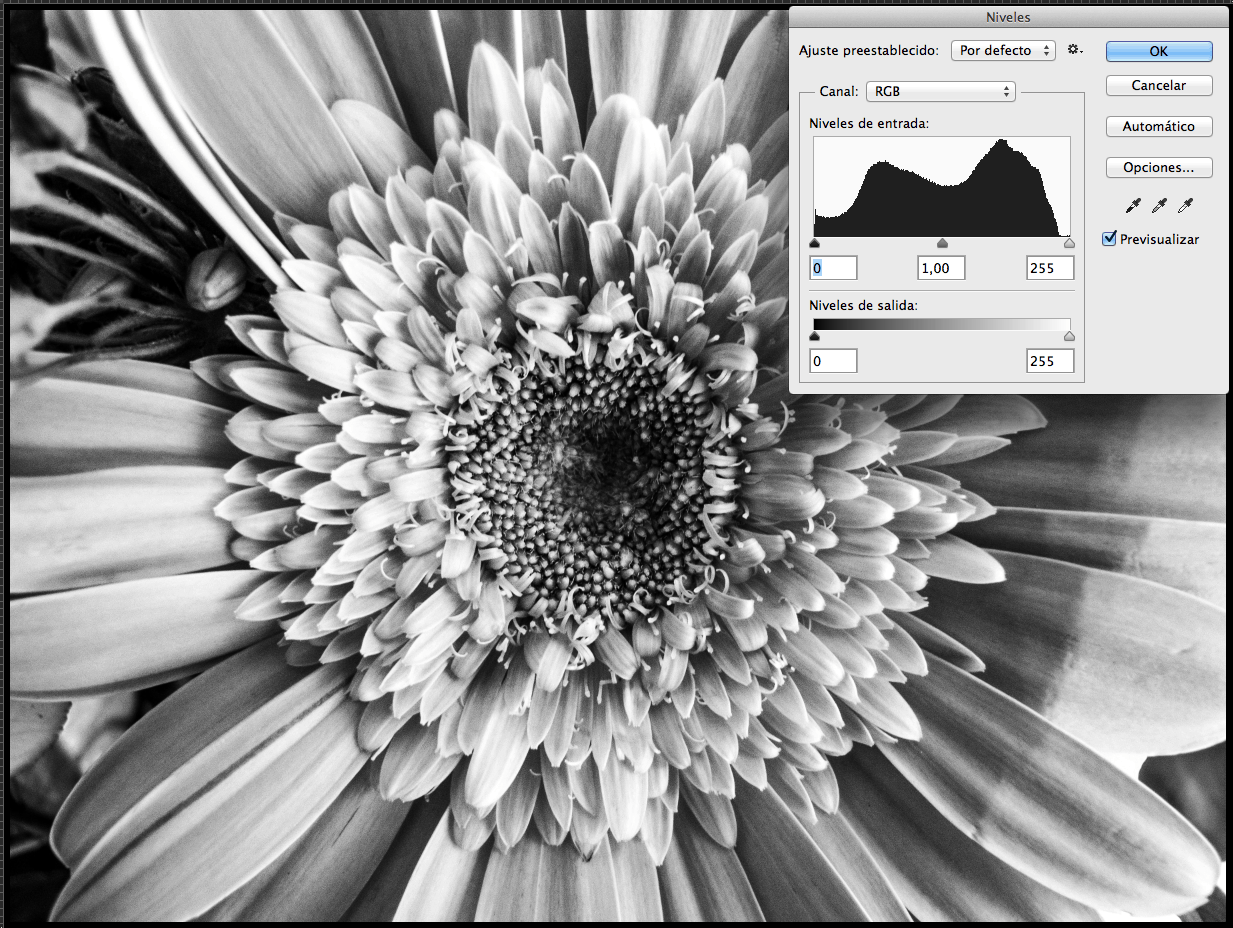
WHAT IS THE HISTOGRAM IN PHOTOGRAPHY?
A histogram is a bar graph used in statistics that shows us the frequency with which certain values are repeated .
Two variables are combined in a histogram, one for each axis. In the case at hand, that of photography, on the vertical axis we find the "amount" of pixels . On the horizontal axis, we find the luminosity values . That is, for each of the columns of the graph we obtain information about its luminosity (light or dark) and about the number of pixels that have this quality.
WHAT IS THE HISTOGRAM USED FOR?
The histogram is the best help that the camera itself will provide you to know if your exposure is correct at the moment you take your picture.
Start to forget about analyzing your images by just looking at them through the screen, as this method is unreliable ; it depends on the ambient light, the quality of the screen, and its own brightness. Don't wait until you get home to make sure that your image was missing a couple of points of light; If you want to start with a well-exposed image, you should always , always, use the histogram to “read” the light in your image.
HOW DO YOU READ A HISTOGRAM IN PHOTOGRAPHY?
We have already said that the horizontal axis shows us the brightness of the image. If we focus on the horizontal axis, we can divide it into three imaginary zones . The area located to the left of the histogram informs us about the shadows of the image. The central zone informs us about the zones of average luminosity, and the right zone, about the zones of lights.
There are as many histograms as there are images, so it is difficult to generalize since the histogram is like a fingerprint of each of the images we get. However, in general , we can state that:
- A histogram with no information in the shadow or middle area, which brings together all the information in the right area of the image ( highlights ), is very likely to be overexposed . It usually reflects not only the information on the right side, but also a number of high pixels (peaks) in the rightmost area of the image, making it seem as if they were going to go off the graph.
- A histogram that accumulates information in the shadows (left), with little or no information in the middle and highlights, is likely to be too dark; underexposed . As in the overexposed histograms, the information tends to accumulate in the form of peaks in the left area, making it seem as if they were going to "get out" of the graph.
- A histogram with all the information accumulated in the same area tells us about an image with little contrast . Whether the light information is concentrated to the right, to the left, or in the middle area. You already know that the light contrast is given by the difference between lights and shadows in an image, so if it lacks differentiation between lights and shadows, the resulting image is known as a low contrast image.
- A histogram with information accumulated at the extremes of the graph (in the highlights and in the shadows) and with little or no information in the mid-light area is a high-contrast histogram , since the difference between highlights and shadows is high, for example a backlit image , would give a histogram similar to the one we are considering.
- A histogram with several peaks shows us a scene where certain tones with information other than the predominant value become relevant. For example, let's take a desert landscape with a general homogeneous tone but in which some Tuaregs dressed in different colors appear in the middle of the landscape. This scenario would probably leave us with a histogram where the peaks would be that "different" light information from the general tone of the image.
EXAMPLES OF READING A TYPICAL CASE
To illustrate the concept here we bring you 3 examples of 3 similar photographs but with different exposures. Notice how the histogram pattern changes to the right, center, or left depending on whether the photo is overexposed, correctly exposed, or underexposed, respectively.
BE CAREFUL WITH THE EXCEPTIONS... THERE ARE MANY
I have already commented that the histogram and its reading is like the fingerprint of an image, that is, each image has its “unique” histogram .
It is often said that a correct exposure is the one that shows us a histogram with information on each of its light parameters, from the highlights to the shadows, and with the values (pixels) well distributed along the entire axis, since that is how it is considered that the image has the greatest dynamic range ; that is, as much tonal information as possible.
- Now, imagine a snowy landscape in broad daylight. Do you think that an exposure that “rights” on the histogram indicates that we have overexposed too much? In this case, where there are no shadows in the image itself, the histogram cannot reflect shadows, if there are no midtones, it cannot reflect midtones either, so it is likely that the histogram of this image is simply like this; the information is on the right because the scene before us is just like that.
Let's take another example:
- A histogram reflecting a landscape at sunset. This shows us all the information accumulated in the left zone of the histogram, that of shadows. But let's say there are some interesting white clouds on the horizon. In this histogram, those clouds are not reflected in the area of lights as they should (since they are bright or clear), so it is very likely that your image lacks light, that is, it is underexposed.
As you can see, there is no rule, but as you use it, with practice and by logic, you will learn to know how to interpret its results on each occasion.
WHERE TO START TO USE THE HISTOGRAM IN PHOTOGRAPHY
Start by setting your camera to show you the histogram after each shot along with a preview of your image. I would venture to say that all DSLRs have this option, and even many compact ones.
Once you have it configured, get used to analyzing the image after each photograph. At first, it may be difficult for you to interpret depending on the scene, but little by little, you will learn to read the histogram in an agile and effective way and you will get adjusted images and with a correct exposure, you will avoid the typical scenes in which the camera's photometer decides by you in the wrong way, etc.
The more you know about your equipment and its possibilities , the more you decide and the less your camera, the better images you will get .
So… don't let those mysterious peaks scare you, in a few days you will have mastered the parameters or the simplest situations, and in a few more days, you will also master the somewhat more complex situations. In a couple of weeks you will have become the king of correct exposure, isn't that tempting? So what are you waiting for? If you put effort into it, in a few days you will hallucinate with your own progress and results and you will think... “How could he have lived without knowing the histogram?
